Ceilometer Error Characteristics
At the lower end of the profile, the optical overlap between the emitted laser pulses and the collecting optical field (typically a telescope with a field of view on the order of 1 mrad) must be constant with height so that signal variations depend only on the properties of the scattering media. As an example, the heights of full overlap of three lidars/ceilometers, provided by the manufacturers, are given in Table 1. Below this altitude, the signal can be corrected by applying an optical overlap function, which helps removing vertical gradients due to incomplete optical overlap.
| Table 1: Main characteristics of three Lidar-ceilometers studied in EG-CLIMET | ||||||
|---|---|---|---|---|---|---|
| Type | Laser Source | Output Laser Energy | Pulse Rate | Altitude Range | Vertical Resolution | Full Optical Overlap |
| Vaisala CL31 | InGasAs 910 nm | 1.2 
|
8.2 kHz | 0m - 7.5km | 5 m | 0 m |
| Leosphere ASL300 | Nd:Yag 355 nm | 16 mJ | 20 Hz | 15m - 20km | 1.5 - 15m | 150 m |
| Jenoptik CHM15k | Nd:Yag 1064 nm | 8 
|
5-7 kHz | 30m - 15km | 15 m | 1500 m |
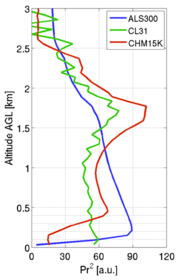
The figure below shows an example of backscatter profile for each instrument (a one hour mean) in a situation where the boundary layer is well mixed. The CL31 profile, albeit a bit noisy due to its low output power, shows an attenuated backscatter profile typical of a well mixed layer from the ground to about 1.8 km (attenuation is weak at 905 nm). According to Münkel et al. (2007), the optical design of the CL31 results in a full optical overlap starting at 0m above the instrument. The ALS300 attenuated backscatter profile increases from ground to 200 m, due to incomplete overlap, and decreases above 200 m due to strong molecular contribution at 355 nm that decreases as a function of pressure. The CHM15k attenuated profile increases to about 450 m and decreases predominantly above 450 m. Between 1.2 and 1.8 km, the attenuated backscatter increases just as in the CL31 signal, probably as a result of increasing aerosol cross section. This is also visible in the ALS300 signal with a small change of slope in that range.
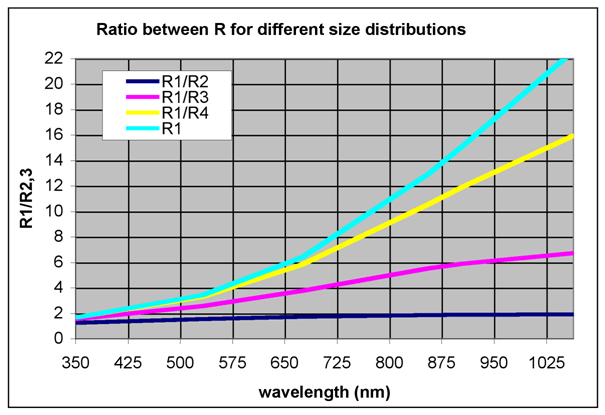
Signal-to-noise ratio At the high end of the profile, detection of gradients in scattering cross section will be limited by the weakness of the backscattered signal to noise ratio with respect to the strength of scattering cross section gradients. Vertical scattering cross section gradients, due to vertical gradients of aerosol size or number concentration, depends strongly on wavelength due to spectral variations of both molecular scattering and aerosol scattering. The aerosol scattering ratio (defined in Ferrare et al. 2001) represents the ratio of total (aerosol + molecular) backscatter coefficient to molecular backscatter coefficient. At 355nm, the aerosol scattering ratio is near 1.5 for typical semi-urban aerosols, while at 905 nm and 1064 nm it is 15 and 25 respectively, as shown in Figure 2.5.3-2 (aerosol population R1). Figure below shows the wavelength sensitivity of aerosol scattering ratios for different aerosol scattering cross sections, varying both aerosol size and number concentrations. The backscatter ratio between two adjacent aerosol populations varies like the aerosol scattering ratio, and hence the stronger the aerosol scattering ratio, the easier a gradient can be identified in the lidar profile. The reference aerosol population (R1) is a semi-urban aerosol with an optical depth of 0.25. R2 corresponds to the same population with half the concentration and an optical depth of 0.125. R3 corresponds to much finer particles with an optical depth of 0.02. R4 is an even finer aerosol population with an optical depth of 0.002. The ratio of R1 to R2 shows that if the aerosol concentration decreases by a factor of 2 in the vertical, the aerosol scattering ratio will be divided by 1.92, 1.87 and 1.26 at 1064 nm, 905 nm, and 355 nm, respectively. If the aerosol vertical gradient goes from a population of a given mean particle size, to a population with half that mean particle size, the aerosol scattering ratio will be divided by 6.72, 5.90 and 1.56 at 1064 nm, 905 nm, and 355 nm, respectively.

